SPY's Pullback Creates Rare Entry Point - Technical Analysis
The SPY ETF (S&P 500 tracker) is teetering on the brink of a breakout, and the next few days could be pivotal for traders and investors alike. The market is buzzing with anticipation as SPY dances near critical levels, hinting at a potential surge that could redefine short-term trading strategies. The stage is set, but will the market's key players make their moves, or will they wait for more clarity?
Why does this matter right now? The SPY's current positioning amidst a risk-on environment and macroeconomic backdrops paints a complex picture. With the broader market sentiment leaning positive and growth stocks leading the charge, SPY finds itself at a crossroad. This week matters because the SPY is flirting with the significant $700 psychological level—a point that could act as a springboard for further gains or a barrier that repels bullish attempts.
As we delve deeper into this setup, we'll uncover the technical signals that Wall Street is eyeing, the scenarios that could unfold, and the strategic trading opportunities that could arise. Buckle up as we navigate through this intriguing market landscape.
MARKET CONTEXT
To understand the SPY's current standing, we must first explore the broader market context. The market is in a risk-on regime, a mood that's generally favorable for equities. Both the SPY and QQQ ETF (NASDAQ-100 tracker) are experiencing upticks, with the QQQ marginally outpacing SPY. This indicates a strong performance from growth stocks, often a harbinger of bullish times ahead.
The DXY Index (US Dollar Index) is showing signs of weakness. A soft dollar typically makes U.S. equities more attractive to foreign investors, adding an extra layer of support to the bullish thesis. Meanwhile, the TLT ETF (20+ Year Treasury) illustrates rising yields, yet the market seems unperturbed. This suggests traders are interpreting the rising yields as a sign of economic strength rather than impending inflation concerns—fuel for the equity market's fire.
CURRENT SETUP
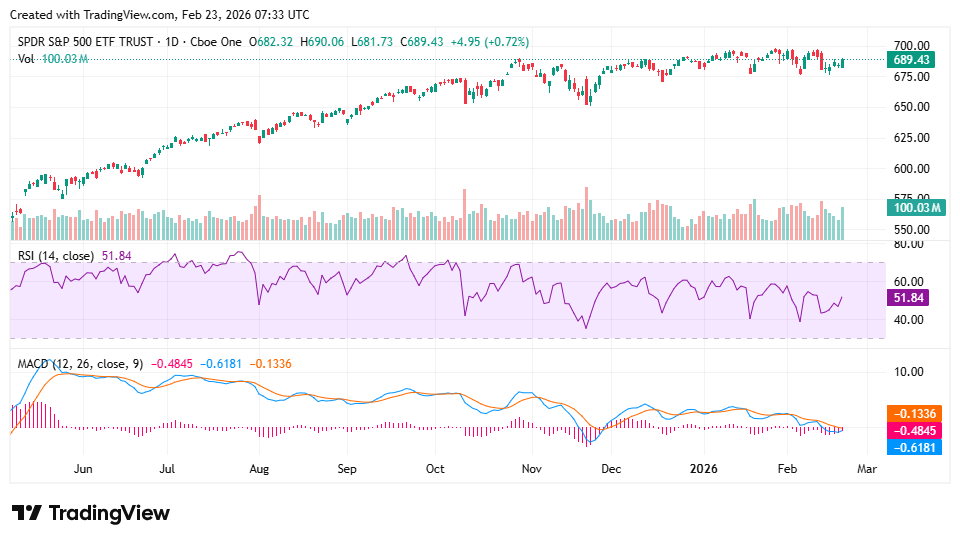
At present, the SPY stands on the cusp of greatness. Hovering near its all-time highs, today's price action has been decidedly positive. It's a bullish trend with the SPY just shy of the $700 mark—a formidable psychological and technical resistance level.
The price action analysis reveals a noteworthy bullish candlestick pattern, underscoring a continuation of upward momentum. For traders, the critical support levels lie at $680 and $670, offering a safety net should the market face a swift downturn. Conversely, a breach of the $700 level could ignite a flurry of buying activity, propelling SPY toward new heights.
TECHNICAL DEEP DIVE
Diving into the technicals, the landscape is filled with cues for the astute trader. The Relative Strength Index (14) sits at a neutral 51.84, indicating that neither overbought nor oversold conditions prevail. This neutrality often precedes volatility, as it suggests the market is biding its time before making a pronounced move.
The MACD paints a more nuanced picture. While the MACD line lingers below the signal line, indicating potential bearish sentiment, the histogram's narrowing signals a weakening of bearish momentum. Traders should watch for a potential bullish crossover, which could foreshadow a significant rally.
Moving averages, a staple in technical analysis, are not explicitly plotted in this analysis, but it's essential to note that when prices trade above their moving averages, it's a bullish indicator, and that's exactly where SPY finds itself. The current market dynamics, particularly with the SPY's performance, can be further understood in the context of trends like dollar and US futures fluctuations.
Fibonacci retracement levels offer yet another perspective. Considering a hypothetical pullback from the recent high near $700 to a visual support level around $650, key retracement levels include $688, $681, and $669. The SPY currently tests the 23.6% retracement level around $688, placing it in a precarious position. Should it breach this level, Fibonacci extension targets of $714 and $730 come into play, assuming the momentum sustains.
THE THREE SCENARIOS
The market's current setup gives rise to three primary scenarios: bullish, neutral, and bearish. Each scenario presents its own set of conditions, targets, and probabilities.
The bullish scenario, holding a 50% probability, hinges on SPY's ability to close above the $700 level. Such a move would likely trigger additional buying, propelling the price toward the $710 mark within a 30-day timeframe. The bullish environment is bolstered by the risk-on mood and technical indicators, which suggest a potential for further gains.
The neutral scenario, with a 30% likelihood, envisions SPY oscillating between $680 and $700 for the next month. This range-bound trading reflects a market in search of direction, possibly awaiting clearer macroeconomic signals or a shift in sentiment before committing to a trend.
The bearish scenario, albeit with a lower 20% probability, could unfold if SPY breaks below the $680 support level. Such a breakdown might precipitate a retreat to the $660 range, punctuated by negative news or an abrupt change in market sentiment.
TRADING STRATEGY
For traders looking to capitalize on these potential movements, the following trading strategies are proposed, each tailored to different risk appetites:
Conservative traders might consider entering the market around $690, with a stop loss at $675, risking 2.17% of their position. The first target would be $705, with a potential second target of $715, offering a 1:1 risk/reward ratio and a position size of up to 0.5% of the portfolio.
Moderate traders could enter slightly higher at $691, with a stop at $670, accepting a 3.04% risk. Targets are set at $710 and $720, with a 1:0.9 risk/reward ratio, and a 1% portfolio allocation. The current trading strategy might be influenced by recent market fluctuations, such as Bitcoin dips under $65K amid new tariff uncertainty.
Aggressive traders might opt to enter around $692, with a stop loss at $665, embracing a 3.90% risk. Their targets would include $715 and $725, with a 1:0.85 risk/reward ratio, and a 2% position size.
Regardless of the approach, the risk/reward ratios are less than ideal, suggesting that traders should proceed with caution and perhaps prioritize the conservative strategy.
RISK FACTORS
Despite the bull case, several risk factors could derail the anticipated rally. Unexpected economic news, a sudden shift in market sentiment, or geopolitical events could all prompt a market correction. Inflation data exceeding expectations could lead to a hawkish Federal Reserve policy shift, posing a significant threat to equities.
A daily close below $680 would invalidate the bullish thesis, while a weekly close below $650 would signal a more substantial breakdown, warranting reevaluation of any long positions.
THE BOTTOM LINE
The SPY stands at a critical juncture, with its current levels presenting both an opportunity and a challenge. The $700 psychological barrier is the key level to watch, with a potential rally to $710 and beyond if breached. Traders must remain vigilant, keeping an eye on support levels around $680 and $670 as potential signals for a bearish reversal.
KEY TAKEAWAYS
- SPY is in a risk-on market environment, with significant growth stock performance.
- Critical resistance at $700 could spark a rally if breached.
- Key support levels are $680 and $670.
- Neutral RSI indicates potential for volatility.
- MACD suggests weakening bearish momentum.
- Fibonacci extension targets are $714 and $730.
- Bullish scenario has a 50% probability with a $710 target.
- Risk/reward ratios warrant a cautious approach.
- A daily close below $680 invalidates the bullish thesis.
- Conservative trading strategy is recommended.
FAQ
Thinking of trading SPY right now?
That's one option, but what if there are better opportunities hiding in plain sight?
InteractiveCrypto Pro's AI has identified trading signals with 94% historical accuracy - opportunities that often get overlooked by individual investors.
Compare your choice against our AI-powered analysis - with real-time alerts, Fair Value estimates, and 40+ technical indicators analyzed automatically.
Get professional-grade analysis every day, now available at 50% off while our New Year Sale lasts. Hurry, offer ends soon! As the market fluctuates, investors are keenly watching trends, such as Nvidia's stock stagnation and the potential impact of upcoming earnings reports.